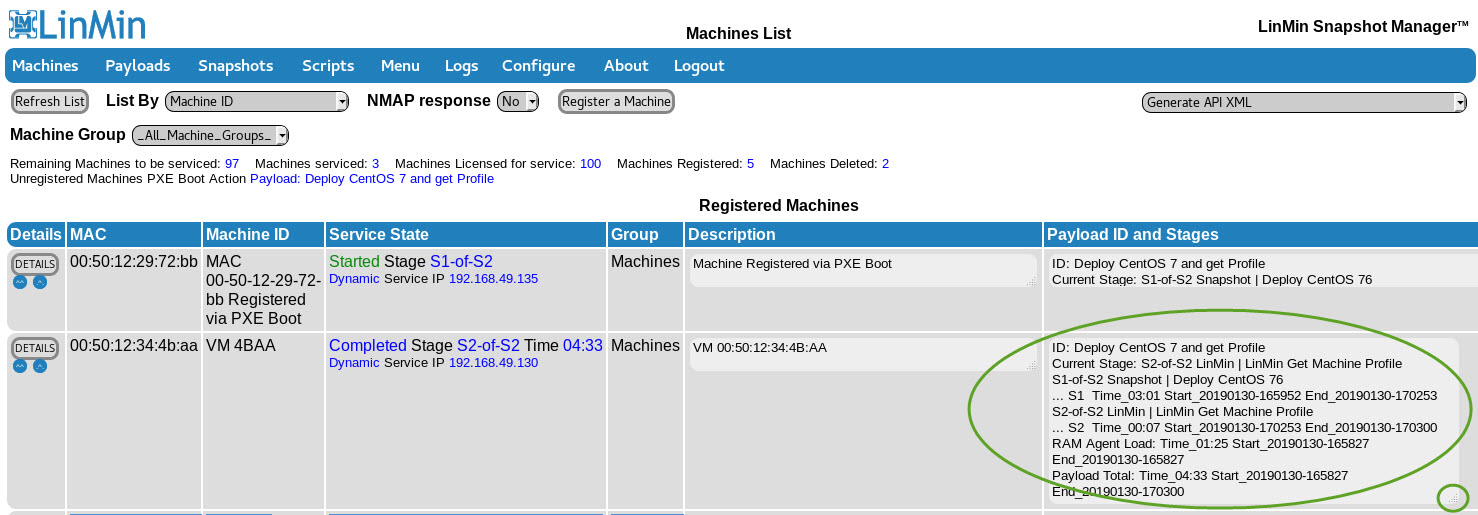
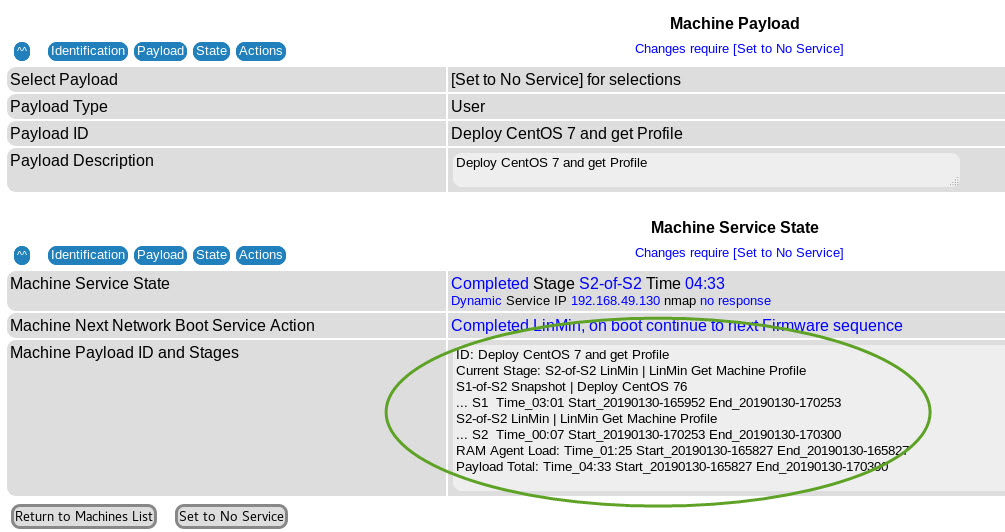
LSM measures the time for an entire Payload service to complete, as well as intermediate time metrics (each stage and RAM Agent load time)
Examples of metrics collected during LSM servicing:
In Machines >:
In Machines > Machine Details:
Example Payload: Capture CentOS 7.6 minimal server VM and get Machine Profile
ID: Capture any Machine then get Machine Profile
Current Stage: S2-of-S2 LinMin | LinMin Get Machine Profile
S1-of-S2 Snapshot | Capture PXE Image Grabber
... S1 Time_03:41 Start_20190109-173558 End_20190109-173939
S2-of-S2 LinMin | LinMin Get Machine Profile
... S2 Time_00:09 Start_20190109-173939 End_20190109-173948
RAM Agent Load: Time_01:37 Start_20190109-173421 End_20190109-173421
Payload Total: Time_05:27 Start_20190109-173421 End_20190109-173948
Example Payload: Deploy CentOS 7.6 to a VM and get Machine Profile
ID: Deploy CentOS 76 MySQL VM then get Machine Profile
Current Stage: S2-of-S2 LinMin | LinMin Get Machine Profile
S1-of-S2 Snapshot | Deploy CentOS 76 MySQL VM
... S1 Time_02:56 Start_20190109-175732 End_20190109-180028
S2-of-S2 LinMin | LinMin Get Machine Profile
... S2 Time_00:06 Start_20190109-180028 End_20190109-180034
RAM Agent Load: Time_01:27 Start_20190109-175605 End_20190109-175605
Payload Total: Time_04:29 Start_20190109-175605 End_20190109-180034

